
Paying for College: Income Driven Repayment Plans

Income Driven Repayment Plans
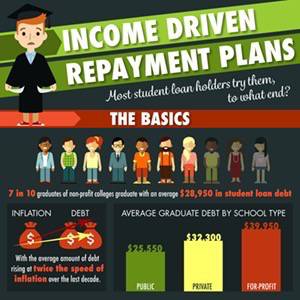
Most student loan debt holders try them, to what end?
The Basics:[4]
7/10 graduates of non-profit colleges graduate with an average $28,950 in student loan debt
With the average amount of debt rising at twice the speed of inflation over the last decade.
Average graduate debt by school type:[5]
Public: $25,550
Private: $32,300
For-Profit: $39,950
Nearly all graduates are affected:[4]
[percentage of public four year graduates with debt by state]
Alabama – 4-year or above 50
Alaska – 4-year or above 54
Arizona – 4-year or above 57
Arkansas – 4-year or above 55
California – 4-year or above 55%
Colorado – 4-year or above 56%
Connecticut – 4-year or above 62%
Delaware – 4-year or above 62%
District of Columbia – 4-year or above N/A
Florida – 4-year or above 54%
Georgia – 4-year or above 62%
Hawaii – 4-year or above 47%
Idaho – 4-year or above 72%
Illinois – 4-year or above 67%
Indiana – 4-year or above 61%
Iowa – 4-year or above 68%
Kansas – 4-year or above 65%
Kentucky – 4-year or above 64%
Louisiana – 4-year or above 47%
Maine – 4-year or above 68%
Maryland – 4-year or above 58%
Massachusetts – 4-year or above 65%
Michigan – 4-year or above 62%
Minnesota – 4-year or above 70%
Mississippi – 4-year or above 60%
Missouri – 4-year or above 59%
Montana – 4-year or above 67%
Nebraska – 4-year or above 63%
Nevada – 4-year or above 46%
New Hampshire – 4-year or above 76%
New Jersey – 4-year or above 68%
New Mexico – 4-year or above 48%
New York – 4-year or above 61%
North Carolina – 4-year or above 61%
North Dakota – 4-year or above N/A
Ohio – 4-year or above 67%
Oklahoma – 4-year or above 55%
Oregon – 4-year or above 62%
Pennsylvania – 4-year or above 70%
Rhode Island – 4-year or above 65%
South Carolina – 4-year or above 59%
South Dakota – 4-year or above 69%
Tennessee – 4-year or above 60%
Texas – 4-year or above 59%
Utah – 4-year or above 54%
Vermont – 4-year or above 65%
Virginia – 4-year or above 60%
Washington – 4-year or above 58%
West Virginia – 4-year or above 69%
Wisconsin – 4-year or above 70%
Wyoming – 4-year or above 46%
Alabama – Public, 4-year or above 51%
Alaska – Public, 4-year or above 50%
Arizona – Public, 4-year or above 57%
Arkansas – Public, 4-year or above 54%
California – Public, 4-year or above 53%
Colorado – Public, 4-year or above 57%
Connecticut – Public, 4-year or above 65%
Delaware – Public, 4-year or above 62%
District of Columbia – Public, 4-year or above N/A
Florida – Public, 4-year or above 52%
Georgia – Public, 4-year or above 62%
Hawaii – Public, 4-year or above 45%
Idaho – Public, 4-year or above 71%
Illinois – Public, 4-year or above 66%
Indiana – Public, 4-year or above 60%
Iowa – Public, 4-year or above 62%
Kansas – Public, 4-year or above 63%
Kentucky – Public, 4-year or above 63%
Louisiana – Public, 4-year or above 44%
Maine – Public, 4-year or above 80%
Maryland – Public, 4-year or above 56%
Massachusetts – Public, 4-year or above 75%
Michigan – Public, 4-year or above 61%
Minnesota – Public, 4-year or above 69%
Mississippi – Public, 4-year or above 60%
Missouri – Public, 4-year or above 62%
Montana – Public, 4-year or above 66%
Nebraska – Public, 4-year or above 61%
Nevada – Public, 4-year or above 46%
New Hampshire – Public, 4-year or above 81%
New Jersey – Public, 4-year or above 69%
New Mexico – Public, 4-year or above 48%
New York – Public, 4-year or above 54%
North Carolina – Public, 4-year or above 62%
North Dakota – Public, 4-year or above N/A
Ohio – Public, 4-year or above 65%
Oklahoma – Public, 4-year or above 54%
Oregon – Public, 4-year or above 59%
Pennsylvania – Public, 4-year or above 72%
Rhode Island – Public, 4-year or above 71%
South Carolina – Public, 4-year or above 58%
South Dakota – Public, 4-year or above 67%
Tennessee – Public, 4-year or above 60%
Texas – Public, 4-year or above 59%
Utah – Public, 4-year or above 54%
Vermont – Public, 4-year or above 64%
Virginia – Public, 4-year or above 57%
Washington – Public, 4-year or above 55%
West Virginia – Public, 4-year or above 69%
Wisconsin – Public, 4-year or above 68%
Wyoming – Public, 4-year or above 46%
But while loans are easily handled by some graduates, many others default.
Ruining your credit score
Taking away federal benefits
Potentially forcing wage garnishment
Or allowing organizations to seize your property
Never fear, nearly all IDR borrowers are able to make their payments…
What is IDR?
IDR (Income Driven Repayment)[2]
Definition: student loan repayment plans that lower monthly payments for student loan holders with “partial financial hardship.”
Partial financial hardship = student loan payments > (greater than) 15% of the borrowers discretionary income.
Discretionary income = everything over 150% of the federal poverty line for a family the borrower’s size.
And if you still have a balance after 20 years, most IDR plans offer loan forgiveness.
Example:
A family of four with an income of $50,000 or less would be found to have partial financial hardship if they paid more than $170.31 in student loan payments a month.
(a) Family of four income: $50,000
(b) 2016 Federal Poverty Line for Family of Four: $24,250
(c) 150% of poverty line for four: $36,375
(d) Discretionary income = a – c ($13,625)
(e) 15% of Discretionary = d * .15 ($2,043.75)
(f) Monthly payment limit = e / 12 ($170.31)
Find the out if you qualify for partial financial hardship below:
Household Size/ 100%/ 150% federal poverty line
1 $11,770 $17,655
2 $15,930 $23,895
3 $20,090 $30,135
4 $24,250 $36,375
(Your income – 150% of federal poverty line) *.15
/12
= payment above which you probably qualify for IDR
Who uses IDR
Two out of three federal student loan borrowers use IDR Plans[1]
50% of these borrowers plan to use IDR until their plans are paid off
50% aren’t sure how long they’ll use IDR
Expectations:
1/5 expect to use IDR for less than 5 years
3/5 expect to make higher payments as their income increases
Earnings:
1/2 IDR borrowers make less than $35,000
Employment:
9/10 are employed
Education:
76% hold bachelors degrees
40% masters or above
Information:
Most commonly cited source of IDR info: Department of Education Loan Servicers
Most common confusion: large variety of repayment plan options
Delinquency:
90% are current on student loan payments
Payment amount:
1/3 qualify for $0 payments
While school is expensive, it’s also often important. Don’t let student loans ruin your chances at a bright future. Instead, explore all repayment options–including IDR repayment plans–to come up with a solution that works for you!
Sources
- https://globenewswire.com/news-release/2015/11/24/790033/0/en/Survey-finds-IDR-plans-are-essential-for-new-grads-and-low-income-households-today-while-long-term-use-of-the-plans-is-uncertain.html
- https://equaljusticeworks.org/ed-debt/income-based-repayment
- https://www.parkviewmc.com/app/files/public/1484/2016-Poverty-Level-Chart.pdf
- https://college-insight.org/#explore/go&h=ae487dc9c317725535aeb7f563a33914
- https://ticas.org/sites/default/files/pub_files/Debt_Facts_and_Sources.pdf